▶ Watch related videos on YouTube — Search results for: Analyzing escalated topics and intents in Agentforce studio analytics
Understanding the Requirement
Teams running Agentforce Studio Analytics often require a deeper understanding of the topics and intents that are being escalated, to inform their roadmapping decisions.
This requires access to data on the number of sessions that are being escalated for each topic and intent, which can then be used to prioritize development efforts.
Root Cause of the Limitation
The Agentforce Studio Analytics screens provide a range of pre-built overviews, but do not currently include a readymade dashboard for viewing escalated topics and intents.
Extracting the Data
To extract the required data, you can use SQL queries to access the underlying data tables in Agentforce.
For example, you can use a query like the following to extract the number of escalated sessions for each topic:
SQL Query
SELECT topic, COUNT(*) AS escalated_sessions
FROM agentforce_sessions
WHERE escalation_status = 'escalated'
GROUP BY topic;
This query can be modified to extract data on intents, or to include additional filters and criteria as required.
Visualizing the Data
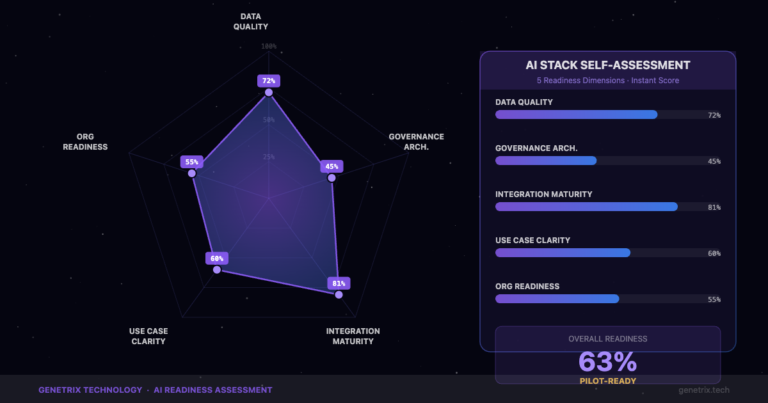
Once the data has been extracted, it can be visualized using a range of tools and techniques, including charts, graphs, and dashboards.
Next Steps
Checklist for Analyzing Escalated Topics and Intents
- Extract the required data using SQL queries
- Visualize the data using charts, graphs, and dashboards
- Use the insights gained to inform roadmapping decisions
- Refine and iterate on the analysis as required
- Consider using additional tools and techniques, such as machine learning and predictive analytics
Frequently Asked Questions
What is the best way to extract data from Agentforce Studio Analytics?
The best way to extract data is to use SQL queries, which can be used to access the underlying data tables.
Can I use the pre-built overviews in Agentforce Studio Analytics to view escalated topics and intents?
No, the pre-built overviews do not currently include a readymade dashboard for viewing escalated topics and intents.
How can I visualize the data once it has been extracted?
The data can be visualized using a range of tools and techniques, including charts, graphs, and dashboards.
What are some additional tools and techniques that I can use to analyze escalated topics and intents?
Some additional tools and techniques that you can use include machine learning and predictive analytics, which can be used to gain deeper insights and make more informed decisions.
Need help shipping this in production?
Genetrix builds and untangles Salesforce Marketing Cloud and Agentforce setups for teams that want it done right the first time. If anything in this post sounds familiar, talk to us before it ships.